
Stock market prediction is a classic yet challenging application of Machine Learning and Deep Learning techniques. In this blog, I’ll take you through my journey of building a predictive model for NIFTY50 stock prices using a Long Short-Term Memory (LSTM) network.
Introduction
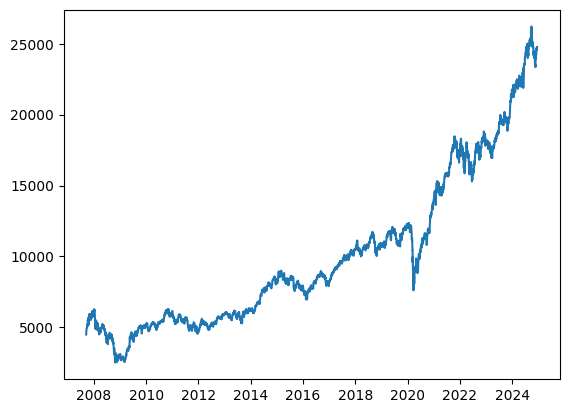
The NIFTY50 index represents the performance of 50 major companies listed on the National Stock Exchange (NSE) of India. Predicting its price trends can help traders and investors make informed decisions. Unlike traditional machine learning models such as Random Forest or Linear Regression, LSTM networks excel at capturing temporal dependencies in sequential data, making them ideal for stock price forecasting.
Data Collection and Preprocessing
The dataset used in this project was sourced from Yahoo Finance, containing historical stock prices for the NIFTY50 index. The data included key features such as:
- Open Price
- High Price
- Low Price
- Close Price
- Volume
Steps for preprocessing:
- Handling Missing Values: Missing data points, if any, were filled using forward-fill techniques.
- Feature Selection: For this project, the ‘Close Price’ column was chosen as the target variable for prediction.
- Normalization: Data normalization was performed using MinMaxScaler to scale values between 0 and 1, which helps accelerate model convergence.
- Training and Testing Split: The dataset was split into an 80–20 ratio for training and testing.
- Creating Sequences: Sliding window sequences were generated to train the LSTM on past ‘n’ days’ prices to predict the next day’s price.
Building the LSTM Model
Model Architecture:
- Input Layer: Accepts sequences of shape (timesteps, features).
- LSTM Layer: A single LSTM layer with 50 units to capture temporal dependencies.
- Dropout Layer: Dropout with a rate of 0.2 to prevent overfitting.
- Dense Layer: A fully connected layer with 1 neuron to output the predicted price.
Code Snippet:
from tensorflow.keras.models import Sequential
from tensorflow.keras.layers import LSTM, Dense, Dropout

model = Sequential([
    LSTM(units=50, return_sequences=True, input_shape=(X_train.shape[1], X_train.shape[2])),
    Dropout(0.2),
    LSTM(units=50, return_sequences=False),
    Dropout(0.2),
    Dense(units=1)
])

model.compile(optimizer='adam', loss='mean_squared_error')
Training the Model:
The model was trained for 50 epochs with a batch size of 64 using the Adam optimizer. The Mean Squared Error (MSE) loss function was used to minimize the prediction error.
Results and Evaluation
The model’s performance was evaluated using Mean Squared Error (MSE) and Mean Absolute Error (MAE) metrics. Here’s a snapshot of the results:
- Training Loss: 0.0009
- Validation Loss: 0.0012
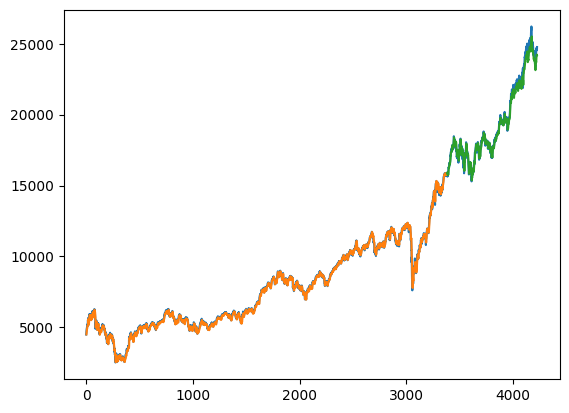
The predicted stock prices closely followed the actual values, as seen in the visualization below:
Key Observations:
- LSTM captured the general trend in stock price movements effectively.
- Sudden spikes or drops were moderately predicted due to the inherent unpredictability of stock markets.
Visualization
The model’s predictions versus actual prices are plotted to evaluate its effectiveness:
import matplotlib.pyplot as plt

plt.figure(figsize=(14, 5))
plt.plot(actual_prices, color='red', label='Actual Prices')
plt.plot(predicted_prices, color='blue', label='Predicted Prices')
plt.title('NIFTY50 Price Prediction')
plt.xlabel('Time')
plt.ylabel('Price')
plt.legend()
plt.show()
The Output
Visualization of actual vs. predicted NIFTY50 stock prices using the LSTM model, showcasing its ability to capture overall trends effectively.
Conclusion
This project demonstrates how LSTM networks can be leveraged for time-series forecasting in financial markets. While the model performed well in capturing trends, stock prices remain influenced by external factors such as economic events and market sentiment, which are beyond the scope of this model.
Future Improvements:
- Incorporating sentiment analysis of news headlines or social media discussions to enrich predictions.
- Experimenting with advanced architectures like Bidirectional LSTMs or Transformer models.
- Fine-tuning hyperparameters for further optimization.
Feel free to explore the code and results on my GitHub. Let me know your thoughts and suggestions in the comments below!